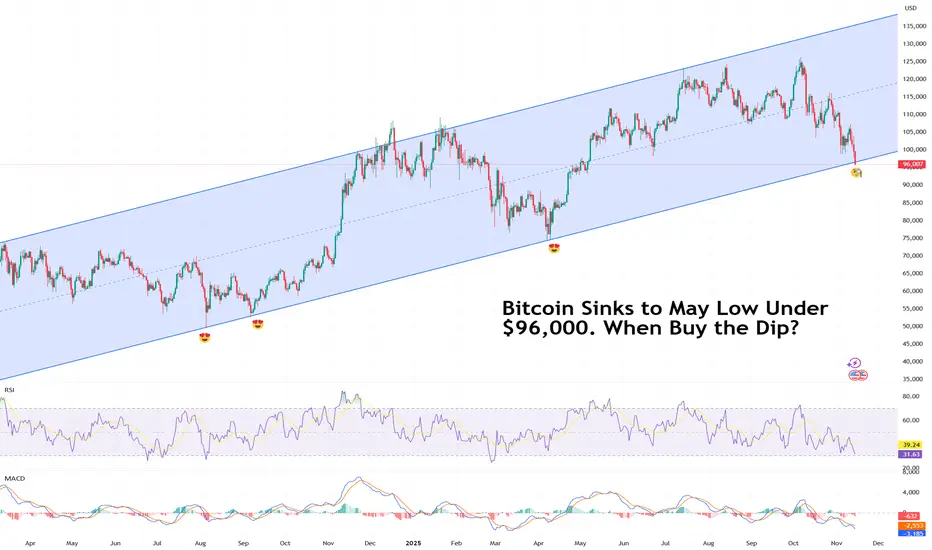
Bitcoin Sinks to May Low Under $96,000. When Buy the Dip?Because sometimes the dip just keeps on dipping.
Bitcoin BITSTAMP:BTCUSD can’t seem to catch a break. The flagship crypto slid below $96,000 on Friday, a level last seen in May, and traders aren’t exactly rushing to buy the dip.
The decline caps a tough few weeks for the OG coin, now lower by about 24% from its record high of $126,000 .
The selloff hasn’t been contained to just Bitcoin. The whole crypto market has been slammed.
Ethereum BITSTAMP:ETHUSD stumbled into the low $3,100s, while Solana COINBASE:SOLUSD fell to the mid-$140s. The entire digital asset space looks winded, and this time, the usual quick rebounders and sharpshooters are sitting on their hands.
What’s going on? In short — traders are nervous, the data floodgates are about to open, and the Federal Reserve isn’t giving anyone the all-clear just yet.
🧨 Buy Dip or Wait for Data?
The end of the US government shutdown should’ve been good news — until investors remembered what comes next.
All the pent-up economic reports that couldn’t be released during the freeze are about to hit the tape: jobs data, inflation numbers, and other key reads that could shape the Fed’s next move.
The bad news: December rate cut isn’t guaranteed. Markets had been leaning heavily on that expectation to justify the monthslong risk-on rally. Now, with the data torrents about to test that narrative, traders are hedging their bets — and Bitcoin’s getting caught in the crossfire.
If the upcoming reports show the economy is still running hot, the Fed might delay cuts. And higher-for-longer rates are basically kryptonite for speculative assets.
💀 Liquidations and Leverage: A Familiar Story
Bitcoin’s latest slump wasn’t just about macro nerves — it was also a good old-fashioned liquidation cascade.
As prices dipped under key technical levels, margin traders got squeezed out in a hurry. According to data from liquidation trackers, over $220 million in crypto positions were wiped out in just one hour. In the past 24 hours? North of $600 million gone.
In previous dips, you’d see traders rushing to scoop up discounted coins, confident that the bounce would follow. The hesitation this time speaks volumes: sentiment’s shifting, and traders are more cautious after months of euphoric rallies in both AI stocks and crypto.
🌡️ The Contagion Spreads
Crypto weakness isn’t isolated anymore — it’s part of a bigger story. Risk assets everywhere are under pressure. The AI trade is cooling, tech stocks are wobbling , and volatility is creeping back into markets that had gone eerily calm.
In short, when traders start treating crypto like a growth stock proxy, Bitcoin stops being a hedge and starts acting like the Nasdaq on leverage.
🪙 So… When to Buy the Dip?
That’s the million-satoshi question. Historically, deep Bitcoin drawdowns during otherwise healthy macro backdrops have rewarded patience. But this time, the setup’s trickier. The next few weeks should bring a barrage of data that could redefine everything from rate expectations to risk appetite.
What can you do now? Watch the data, respect the trend, and don’t fight momentum.
Notice how the long-term upside swing on the daily is still there. But as they say, past performance isn't an indication of future results.
The Fed’s next move, coming early December, will likely decide if this dip becomes a real buying opportunity.
Off to you : Are you looking to buy the dip or you’re waiting for the dip of the dip? Share your strategy in the comments!
Community ideas
Bitcoin Faces the Death Cross — More Pain Ahead?Considering Bitcoin ( BINANCE:BTCUSDT )’s recent movements over the past few days and the Death Cross will happen to BTC, I’ve decided to focus on a daily time frame for today’s analysis. Given the recent events in the U.S. market, especially the sharp decline in the S&P 500 ( SP:SPX ), it’s likely that this downward trend will continue .
What is a Death Cross?
A Death Cross occurs when the 50-day moving average crosses below the 200-day moving average, often signaling a potential bearish trend.
At present, Bitcoin broke the important weekly Support lines and is now breaking a critical Support zone($101,500-$98,200) .
Moreover, considering the correlation with the S&P 500 index, and the fact that the U.S. indices are beginning to recover, it’s unlikely that Bitcoin will decouple from this trend. Therefore, we can anticipate further decline in Bitcoin as well .
Additionally, the rising USDT.D% ( CRYPTOCAP:USDT.D ) is breaking through resistance levels, which can lead to further selling pressure in the crypto market .
In summary, I expect Bitcoin to lose its current Support zone($101,500-$98,200) soon and move towards the Cumulative Long Liquidation Leverage($93,300-$91,300) .
Note: In these times, it’s crucial to maintain strict risk management, as Bitcoin’s volatility has increased. It might also be wise to consider higher time frames for trading to better navigate this complexity.
First Target: $95,720
Second Target: $93,040
Stop Loss(SL): $106,000
Cumulative Short Liquidation Leverage: $112,590-$111,459
Please respect each other's ideas and express them politely if you agree or disagree.
Bitcoin Analysis (BTCUSDT), Daily time frame.
Be sure to follow the updated ideas.
Do not forget to put a Stop loss for your positions (For every position you want to open).
Please follow your strategy and updates; this is just my Idea, and I will gladly see your ideas in this post.
Please do not forget the ✅' like'✅ button 🙏😊 & Share it with your friends; thanks, and Trade safe.

Bitcoin - Is This Where The Pain Finally Ends?Bitcoin has been grinding lower for about a month after sweeping the previous all time high, which created the shift that kicked off this broader downtrend. Since that sweep, every push up has been met with selling, and the market has slowly bled its way back into a major support zone that has been significant in earlier cycles. This is the kind of level where the market usually makes a statement, either by holding and reversing or by breaking and opening the door to a deeper move.
Support Structure and Key Reaction Point
Price is sitting inside a wide support band that has given strong reactions in the past. It is a level traders know well and one that typically slows the market down. The difference this time is the structure leading into it. The downtrend has been consistent, with a string of lower highs showing that sellers remain in control for now. How the daily candle closes inside this zone will tell us a lot about whether buyers still have enough strength to defend it or if this level finally gives way.
Recent Liquidity Events and Daily Gap Behavior
Before dropping into this support, Bitcoin ran a recent daily high and instantly filled the gap above it, making it clear that the move was more about collecting liquidity than shifting the trend. After that, price slid lower again and retested the inside of the daily imbalance, but the retest failed to spark any meaningful demand. That kind of behavior often hints at a market that is still hunting lower levels rather than building upside structure.
Bullish Scenario
For sentiment to turn, Bitcoin needs to close back above the midline of this zone. That level is the one that would show buyers are actually stepping back in and absorbing the sell side. If the market can reclaim it, a short term reversal becomes possible, and the first targets would be the inefficiencies left behind during the recent selloff. From there, the market would still need to break a series of lower highs before a proper shift is confirmed on the daily timeframe.
Bearish Scenario
If the daily candle fails to close above that internal level highlighted on the chart, viewers should expect continuation lower to become the more probable scenario. A failed close there tells you buyers did not manage to hold the midpoint of the range, which usually means the market is preparing to reach for deeper liquidity. In that situation, the next major support zone below becomes the logical draw, and the path shown on the chart, a small bounce followed by another leg down, fits well with the current momentum.
Conclusion
Bitcoin is sitting at a decision point. Either this support zone does its job again and gives the market enough fuel for a recovery, or the daily close confirms that the level has weakened and the market is ready to reach for the next higher timeframe support. Until that close gives clarity, patience is key, since this is typically where traders get chopped if they try to force a direction too early.
___________________________________
Thanks for your support!
If you found this idea helpful or learned something new, drop a like 👍 and leave a comment, I’d love to hear your thoughts! 🚀

BITCOIN URGENT UPDATE! Bounce Expected This level is important!IG:BITCOIN Update:
I’ve been saying this for a while: avoid trading altcoins with high leverage in these conditions. If you got caught again, maybe it’s time to pause and rethink the strategy.
Coming back to BTC, we’re close to a 50 EMA crossing below the 200 EMA, but interestingly, these crossovers have often played out opposite to what classical TA suggests.
Right now, BTC is still getting support from the lower trendline of the falling wedge, so while the price action is choppy, it’s not completely bearish yet.
BTC needs to bounce here; otherwise, the setup becomes invalid if we close below 95,785.
DYOR | NFA
#BTC #BTCUSDT
Please hit the like button if you like it, and share your views in the comments section.
Thank you

Gold 30-Min — Volume Buy & Sell Reversals Triggered⚡Base : Hanzo Trading Alpha Algorithm
The algorithm calculates volatility displacement vs liquidity recovery, identifying where probability meets imbalance.
It trades only where precision, volume, and manipulation intersect —only logic.
✈️ Technical Reasons
/ Direction — LONG / Reversal 4110 Area
☄️Bullish momentum confirmed through strong candle body.
☄️Structure shifted with higher-low near key demand base.
☄️Volume expanding confirms order-flow alignment upward.
☄️Buyers reclaimed imbalance with sustained clean break.
☄️Algorithm detects rising momentum under low liquidity.
✈️ Technical Reasons
/ Direction — SHORT / Reversal 4170 Area
☄️Bearish rejection confirmed through sharp candle body.
☄️Lower-high forming beneath resistance supply region.
☄️Volume decreasing confirms exhaustion in price rally.
☄️Sellers regained imbalance with heavy top rejection.
☄️Algorithm detects fading demand and shift to control.
⚙️ Hanzo Alpha Trading Protocol
The Alpha Candle defines the day’s real control zone — the first battle of momentum.
From this origin, the Volume Window reveals where the next precision strike begins.
⚙️ Hanzo Volume Window / Map
Window tracked from 10:30 — mapping true market behavior.
POC alignment exposes institutional bias and breakout potential zones.
⚙️ Hanzo Delta Window / Pulse
Delta window monitors real buying vs. selling power behind each move.
Tracks volume aggression to expose who controls the candle — buyers or sellers.
When Delta aligns with Volume Map, momentum becomes undeniable.

Lingrid | GOLD Potential Channel Retest. Long From SupportOANDA:XAUUSD is climbing back above the broken range structure and retested the 4,150 zone while maintaining bullish pressure from the recent breakout. The chart shows price riding along the upward trendline and forming a higher-low structure beneath the descending trendline. A clean hold above 4,150 keeps the path open for continuation toward channel border at 4,285 as long as buyers defend the retest. Overall, momentum leans bullish with a projected extension into the resistance zone.
⚠️ Risks:
A H4 close back below 4,150 would weaken the bullish continuation setup.
Strong USD data this week could trigger a deeper corrective pullback.
A rejection from the descending red trendline may stall upside momentum and force consolidation.
If this idea resonates with you or you have your own opinion, traders, hit the comments. I’m excited to read your thoughts!

GOLD → Correction and retest 4150 FX:XAUUSD still retains its bullish structure. The price is entering a correction phase within the trading range. The key support level that may attract the attention of MM is 4150.
The probability of a decline in December fell to 51% (from 63% the day before) after hawkish statements by Fed officials. Government bond yields are rising. These factors are putting pressure on gold.
However, a weak dollar, a flight to safe assets amid global market sell-offs, and uncertainty surrounding US data (September reports may be published, but October data is likely to be lost) are providing support for the bullish trend.
Gold retains its growth potential due to macro risks. A short-term correction is possible due to profit-taking ahead of the weekend, but the $4150 level remains key support.
Resistance levels: 4211, 4239
Support levels: 4161, 4150, 4100
Within the current trading range, the focus is on support at 4161 - 4148. A false breakdown and bulls holding prices above key levels could trigger a rebound and growth to local resistance levels...
Best regards, R. Linda!

Gold 30-Min — Volume Buy & Sell Reversals Triggered⚡Base : Hanzo Trading Alpha Algorithm
The algorithm calculates volatility displacement vs liquidity recovery, identifying where probability meets imbalance.
It trades only where precision, volume, and manipulation intersect —only logic.
✈️ Technical Reasons
/ Direction — LONG / Reversal 4178
☄️Bullish momentum confirmed through strong candle body.
☄️Structure shifted with higher-low near key demand base.
☄️Volume expanding confirms order-flow alignment upward.
☄️Buyers reclaimed imbalance with sustained clean break.
☄️Algorithm detects rising momentum under low liquidity.
✈️ Technical Reasons
/ Direction — SHORT / Reversal 4242
☄️Bearish rejection confirmed through sharp candle body.
☄️Lower-high forming beneath resistance supply region.
☄️Volume decreasing confirms exhaustion in price rally.
☄️Sellers regained imbalance with heavy top rejection.
☄️Algorithm detects fading demand and shift to control.
⚙️ Hanzo Alpha Trading Protocol
The Alpha Candle defines the day’s real control zone — the first battle of momentum.
From this origin, the Volume Window reveals where the next precision strike begins.
⚙️ Hanzo Volume Window / Map
Window tracked from 10:30 — mapping true market behavior.
POC alignment exposes institutional bias and breakout potential zones.
⚙️ Hanzo Delta Window / Pulse
Delta window monitors real buying vs. selling power behind each move.
Tracks volume aggression to expose who controls the candle — buyers or sellers.
When Delta aligns with Volume Map, momentum becomes undeniable.

Bitcoin - Will it take the liquidity at $98.000?Bitcoin (BTC) has shown a clear downward price structure in recent days.
After a period of sideways movement and attempts at recovery, selling pressure has once again become dominant, resulting in a sharp decline toward key liquidity zones.
4h Bullish FVG Inversion
BTC has just failed to hold the 4-hour bullish FVG and has closed below it, which now acts as resistance (inversion). This opens the path toward lower levels, and the likelihood of a continued decline remains high. The bulls are currently struggling to regain ground.
Liquidity Sweep
During the most recent session, a liquidity sweep occurred, with the price dipping below previous lows and triggering many stop-losses and sell orders. Although such a move often leads to a technical bounce, overall sentiment remains bearish. The remaining liquidity below the major low around $98,000 continues to create selling pressure and could lead to further downside.
Conclusion
Despite the recent liquidity sweep, there is still no convincing bottom in sight, and downside risk continues to dominate. As long as BTC trades below the 4h FVG inversion and bearish momentum persists, a move toward $98,000 remains the most likely scenario within the current technical outlook.
-------------------------
Thanks for your support. If you enjoyed this analysis, make sure to follow me so you don't miss the next one. And if you found it helpful, feel free to drop a like 👍 and leave a comment 💬, I’d love to hear your thoughts!

NQ Range (11-10-25, Week 7)The 7 week Forecast is in the final week and we are up about 300 points after getting rejected at upper Target. NAZ back in the Churn Zone and did U Turn off Friday lows just under the Mid Level CZ. KL 483 is TZ to 25,333. Key fact is the NAZ and NDX are at long tern TL. Under the TL is Danger Zone to lower CZ and then TLX 24,056. Current range to watch is 25,333 and 24,817. Friday lift was Failed Auction up and these usually will get retested. Could be a start of a U Turn (that will drop and retest). Or, just another Friday pump drop offset that will trap the BTD/FOMO's.

USD/CAD - Fundamental Drives (13.11.2025)🧠 Setup Overview OANDA:USDCAD
USD/CAD continues to face strong rejection from the resistance zone, with price failing multiple times to break above the 1.4020–1.4045 supply area.
The market structure remains bearish as the pair forms lower highs and struggles to sustain upside momentum.
With fundamentals also favoring CAD strength, the downside scenario remains more probable.
📊 Trading Plan🔻 Sell Bias
Look for bearish confirmation near or below the resistance zone
Continuation to the downside expected toward key support levels
🎯 Targets:
1st Support: 1.3969
2nd Support: 1.3950
🔰 Resistance Zone: 1.4020 – 1.4045
⚡ Fundamental Updates (Today – 13 Nov 2025)
1️⃣ Bank of Canada (BoC) signaled no further interest rate cuts, which strengthened the CAD.
• A stable or moderately hawkish BoC typically supports CAD appreciation.
2️⃣ US Treasury yields continue to fall as markets increase bets on the Federal Reserve easing policy in the coming months.
• Lower yields = weaker USD, helping push USD/CAD lower.
📌 High Impact Event Today:
USD - CPI (Inflation Rate) → A softer CPI reading could accelerate USD weakness.
#USDCAD #Forex #TechnicalAnalysis #PriceAction #ResistanceZone #FXMarket #FundamentalAnalysis #ChartPatterns #KABHI_TA_TRADING #ChartsDontLieTradersDontQuit #USD #CAD #TradingView #ForexSignals #BearishSetup #IntradayTrading
⚠️ Disclaimer
This analysis is for education only. It is not financial advice.
Always apply proper risk management and trade based on your own confirmation.
💬 Support My Work ❤️
If this analysis helps you —👉 LIKE 👍 👉 COMMENT 💬 👉 FOLLOW 🔔
Your support motivates more daily chart breakdowns and setups!

BTC Weekly View !BTC / USD
Bitcoin (BTC) followed my previous analysis on October 30th, dropping from $110,000 to its current price of $96,000. check here
What's Next?
Take a Look at the weekly chart:
Bitcoin is currently at a "do or die" support level (trend line + 50-week moving average).
This moving average has been a turning point in previous cycles.
If the price breaks below this level, it will confirm a mid-term bear trend with minimal target around 74k so keep an eye on this chart.

BTCUSD Rebounds From Buyer Zone — Correction Toward $101KHello traders! Let’s take a look at BTCUSD (Bitcoin). After an extended bearish phase inside a broad descending channel, price consistently respected both the resistance and support lines, forming a clear series of lower highs. Each touch of the descending resistance line resulted in a Turned Around reaction, confirming strong seller control throughout the structure. Earlier, Bitcoin broke below its local support area, initiating a deeper correction toward the major Support Level near $96,000. This zone aligns with the lower boundary of the descending channel and historically served as a strong reaction area for buyers. Recently, BTCUSD reached the bottom of the structure and is now showing early signs of a potential pullback. Price is attempting to rebound from the Buyer Zone, aiming toward the nearest resistance cluster around $100,800–$101,600, which also forms the lower boundary of the Seller Zone. This level previously acted as support and is now expected to serve as a strong retest area. As long as price remains below the descending resistance line, the overall trend stays bearish. A short-term bullish correction toward TP1: $101,600 remains possible, especially if buyers maintain control above the $96,000 support. However, if BTC fails to break above the Seller Zone, sellers may step in again, potentially pushing the price back toward the major support and even extending the downtrend. A confirmed breakout above the descending resistance would invalidate the bearish scenario and open the door for a stronger recovery. Please share this idea with your friends and click Boost 🚀

BTCUSD: Bulls Defend $102K Zone — Eyeing Breakout Toward $107KHello everyone, here is my breakdown of the current Bitcoin setup.
Market Analysis
BTCUSD is trading within a well-defined triangle formation after a period of volatile movements between $102,500 and $107,000. The chart shows that price recently rebounded from the Triangle Support Line, aligning with the $102,000–$103,000 Support Zone, where buyers have consistently stepped in to defend this level. This zone has acted as a strong accumulation area, confirmed by multiple bounces and rejection wicks signaling absorption of selling pressure.
Currently, after a fake breakout to the downside, BTCUSD quickly recovered, retesting the Resistance Zone near $105,000–$105,500, which also aligns with the Triangle Resistance Line. This confluence area represents the next key reaction point. A confirmed breakout above this resistance would indicate a potential continuation of the broader bullish trend, while a rejection here could lead to a short-term correction back toward the support base. The market behavior shows constructive consolidation, with higher lows forming along the support trend line — a sign that buyers are gradually regaining control. As long as BTCUSD remains above $102,000, the short-term structure favors further upside movement within the triangle, aiming toward the $106,500–$107,000 resistance area.
My Scenario & Strategy
As long as Bitcoin holds above the $102,000–$103,000 Support Zone, the bullish outlook remains valid. The first upside objective (TP1) is the $106,500–$107,000 Resistance Area, where traders should watch for potential rejection or breakout signals. A confirmed breakout and close above $107,000 could trigger an extension toward $109,000–$110,000, aligning with the upper boundary of the triangle and the previous reaction zone.
However, if BTCUSD fails to hold above $102,000, this would invalidate the bullish scenario and open the way for a deeper pullback toward $100,000–$99,000, where fresh buying interest may emerge. For now, the structure supports buying pullbacks while price remains above the ascending Triangle Support Line, as momentum continues to favor the bulls.
That's the setup I'm tracking. Thank you for your attention, and always manage your risk.

BTC: Bearish Breakdown From ChannelHi!
Bitcoin has broken decisively below the rising channel that has guided price for months, marking a significant shift in market structure. This breakdown aligns with a completed Head & Shoulders pattern, where price failed to hold the right shoulder area and continued lower, confirming bearish momentum.
With the channel support lost and no meaningful bullish reaction on the retest, sellers remain firmly in control. BTC is now heading toward the next major horizontal support around $88,900, which is the key level highlighted in the chart.
Unless buyers reclaim the broken channel support with strong conviction, the path of least resistance remains to the downside.

Gold Near Channel Support – Bulls Preparing for Another Leg Up?Gold ( OANDA:XAUUSD ) is approaching the Support zone($4,193 – $4,137) and the lower line of the ascending channel .
In terms of Elliott Wave theory , it looks like Gold is completing the main wave 4 .
I expect Gold increase from the Support zone($4,193 – $4,137) to Potential Reversal Zone(PRZ) and Resistance zone($4,316 – $4,270) .
First Target: $4,253
Second Target: $4,297
Stop Loss(SL): $4,133
Please respect each other's ideas and express them politely if you agree or disagree.
Gold Analyze (XAUUSD), 1-hour time frame.
Be sure to follow the updated ideas.
Do not forget to put a Stop loss for your positions (For every position you want to open).
Please follow your strategy; this is just my idea, and I will gladly see your ideas in this post.
Please do not forget the ✅ ' like ' ✅ button 🙏😊 & Share it with your friends; thanks, and Trade safe.

Gold: Healthy Correction Before a Fresh High?Hey Traders, in today's trading session we are monitoring XAUUSD for a buying opportunity around 4,135 zone, Gold is trading in an uptrend and currently is in a correction phase in which it is approaching the trend at 4,135 support and resistance area.
Trade safe, Joe.

XAUUSD: Bounce from Support Zone Targets $4,280 ResistanceHello everyone, here is my breakdown of the current Gold setup.
Market Analysis
Gold (XAUUSD) continues to maintain a bullish market structure after successfully recovering from the Support Zone near $4,090–$4,100, where buyers stepped in to defend a key demand area. Following a fake breakout to the downside in late October, price regained momentum and established a new Upward Channel, characterized by higher highs and higher lows — a strong sign of renewed buying pressure.
Currently, gold has already completed two major breakout phases, first reclaiming the support range and then extending toward the mid-channel zone. The current consolidation suggests a temporary pause before another impulsive leg upward. Price is now trading between the $4,190 support and the $4,350 resistance area, where previous reactions indicate strong liquidity. This resistance has acted as a cap for prior rallies, making it a crucial target zone for bulls. As long as the metal holds above the channel’s lower boundary, the short-term trend remains bullish. A minor pullback toward the support area could serve as a healthy correction before another rally unfolds. However, a confirmed break below $4,190 could temporarily weaken the bullish momentum and lead to a deeper retracement.
My Scenario & Strategy
I expect XAUUSD to maintain its bullish trajectory while respecting the ascending channel structure. Buyers may look for potential long setups near the $4,190–$4,200 support zone, targeting the $4,320–$4,350 resistance area (TP1). A breakout and close above $4,350 would open the path toward $4,400+ levels, confirming further continuation of the bullish cycle.
Conversely, a strong bearish break below the channel and support zone could signal a short-term correction toward $4,100 before buyers attempt to regain control. For now, sentiment remains optimistic, and gold continues to look poised for another bullish leg higher within its well-defined upward channel.
That's the setup I'm tracking. Thank you for your attention, and always manage your risk.

Bitcoin Death Cross! Save Yourselves! – November 2025A Death Cross. Sounds terrifying, doesn’t it? Like something out of a low-budget horror film. Here in deepest darkest Bavaria you can’t drive ten minutes without seeing Christ nailed to a cross at every T-junction, it’s practically the local logo. Cross the Austrian border and the numbers multiply like leverage traders in a bull run. Lovely.
But this? This is the real death cross. Or at least, that’s what the market thinks.
Déjà vu… for the third time
This is the third time I’ve written this post. And yes, it’s always at max fear. Every cycle the same: people panic, memes fly, and somewhere someone says, “It’s different this time.” Spoiler: it’s not.
If you’re feeling nostalgic, click the little triangles where the purple arrows point on the chart. you’ll see the previous posts. The critics lined up back then too, bless ’em. Loud voices, small wallets, and Mum's voice in the background "Dinner's ready!".
April 7th, 2025 Death cross
August 18th, 2024 Death cross
The November 17th Death Cross
On the 1-day chart above, the signal is forecast to print by November 17th. That’s when the
50-day SMA (blue) crosses below the 200-day SMA (red) and price action sits under the 200-day line. It’s the technical version of your mother saying, “I’m not angry, just disappointed.”
This forecast uses the Trigg & Leach method, the same one applied to prior crosses and it’s nailed every one since the bull market began.
Closer
Zooming out..
Time to market top: circa 59 days
Here’s the clever bit, or as I call it, the boring maths no one reads. Historically after each Death Cross Bitcoin rallied before topping out. The time between the cross and the pivot has been shrinking:
1st Cycle → 179 days
2nd Cycle → 131 days
3rd Cycle → 99 days
Apply some arithmetic progression, that’s a fancy way of saying “find the difference and pretend it means something.”
Difference 1 131 − 179 = −48
Difference 2: 99 − 131 = −32
Average difference = −40
Therefore 99 − 40 = 59 days.
That puts the potential cycle top mid-January 2026, and wouldn’t you know it, mid-January sell-offs are a Bitcoin tradition older than bad YouTube thumbnails.
Conclusions
So yes, a Death Cross is coming. Cue the headlines, the drama, and the bloke on X explaining Fibonacci levels like they’re sacred scripture.
Look left. Every time this happened, it played out the same way: panic, bounce, despair, recovery. Rinse, repeat.
The maths points to mid-January 2026 for the next swing high, and then gravity takes over.
If it all goes to plan, brilliant. If not, add this one to your growing folder titled “Why I don’t listen to anyone on TradingView.”
Ww
Disclaimer
==============================================================
This isn’t financial advice. I’m not your fund manager, your priest, or your mum.
If you go all-in on Bitcoin because two squiggly lines made a cross, that’s your fault, not mine.
If it pumps, you’ll say you “always knew.”
If it dumps, you’ll tweet “market manipulation.”
Either way, I’ll still be here, drinking tea and laughing at the comment section.
So yes it’s a Death Cross. But relax. It’s just a chart, not the Book of Revelation.
Ahmen

Gold Next zoneGold (XAU/USD) is trading near 4229, holding above support at 4211. A bullish move toward the 4300 target is expected if price breaks above resistance around 4238.

Bitcoin Roadmap => Short-termOver the past few days, Bitcoin ( BINANCE:BTCUSDT ) has been reacting quite sharply to recent news, showing some unexpectedly strong moves. So, first and foremost, it's a good idea to keep risk management in mind and be prepared for various scenarios .
At the moment, Bitcoin is approaching a Support zone($102,000,980-$96,880) , a Potential Reversal Zone (PRZ) , and a Cumulative Long Liquidation Leverage($99,900-$98,188) .
From an Elliott Wave standpoint, it appears that Bitcoin is completing a Zigzag correction(ABC/5-3-5) .
I expect that from this Potential Reversal Zone (PRZ) and the Cumulative Long Liquidation Leverage($99,900-$98,188) , Bitcoin might start rising again and could potentially reach around $105,171(First Target) .
Second Target: $107,291
Stop Loss(SL): $98,797
Cumulative Short Liquidation Leverage: $108,582-$106,850
Cumulative Short Liquidation Leverage: $112,590-$111,459
Please respect each other's ideas and express them politely if you agree or disagree.
Bitcoin Analysis (BTCUSDT), 1-hour time frame.
Be sure to follow the updated ideas.
Do not forget to put a Stop loss for your positions (For every position you want to open).
Please follow your strategy and updates; this is just my Idea, and I will gladly see your ideas in this post.
Please do not forget the ✅' like '✅ button 🙏😊 & Share it with your friends; thanks, and Trade safe.

BTC CRACK! UPDATE WARNING!!⚠️ BTC CRACKS — Officially in a Bear Market (-24%)
Bitcoin has now broken below $97,000, down 24% from its highs, officially entering bear-market territory.
I’ve been warning about this setup for months — not because I enjoy being bearish, but because the structure was screaming caution.
This isn’t a “buy-the-dip” moment or a garden-variety correction. We’ve hit a major technical and psychological level that could decide the next phase for the entire crypto space.
If this level fails, expect a chain reaction across risk assets — leverage, liquidity, and sentiment all roll over together.
It could be years before you see another uptrend. Note: This is not a short-term trade.
Stay sharp. The real test for crypto starts now.
Thank you ALL FOR getting me up to 5,000 followers!! ))
Click boost, follow, comment nicely for more authentic, no BS, raw analysis. Let's get to 6,000 followers. ))

14.11.25 Morning ForecastPairs on Watch -
FX:GBPUSD
A short overview of the instruments I am looking at for today, multi-timeframe analysis down to what I will be looking at for an entry. Enjoy!
